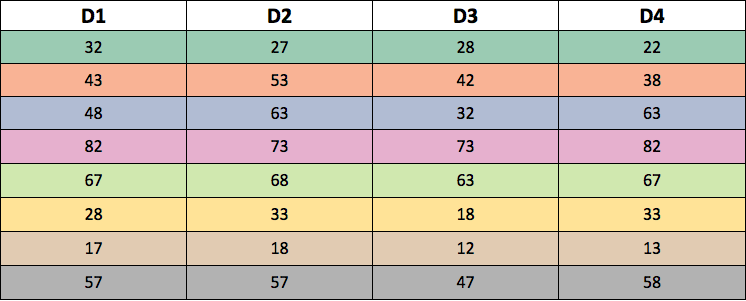
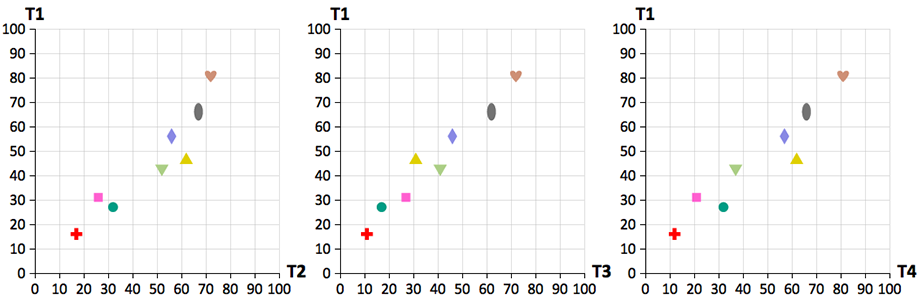
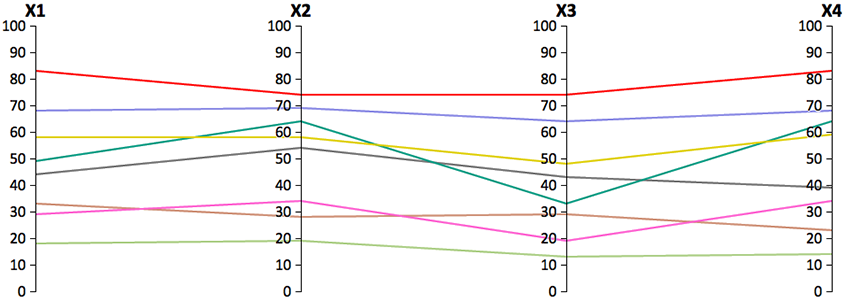
Sample stimuli for the change detection task at the hard level of task difficulty.
Abstract | Paper | Supplementary Material
Sample stimuli for the change detection task at the hard level of task difficulty.
Previous empirical studies for comparing parallel coordinates plots and scatter plots showed some uncertainty about their relative merits. Most of these studies focused on the task of value retrieval, where visualization usually has a limited advantage over reading data directly. In this paper, we report an empirical study that compares user performance, in terms of accuracy and response time, in the context of four different visualization tasks, namely value retrieval, clustering, outlier detection, and change detection. In order to evaluate the relative merits of the two types of plots with a common base line (i.e., reading data directly), we included three forms of stimuli, data tables, scatter plots, and parallel coordinate plots. Our results show that data tables are better suited for the value retrieval task, while parallel coordinates plots generally outperform the two other visual representations in three other tasks. Subjective feedbacks from the users are also consistent with the quantitative analyses. As visualization is commonly used for aiding multiple observational and analytical tasks, our results provided new evidence to support the prevailing enthusiasm for parallel coordinates plots in the field of visualization.